
Data updated on 5 September 2026Data updated: 5 Sept 2026
Cunit Residencial · Cunit · Tarragona
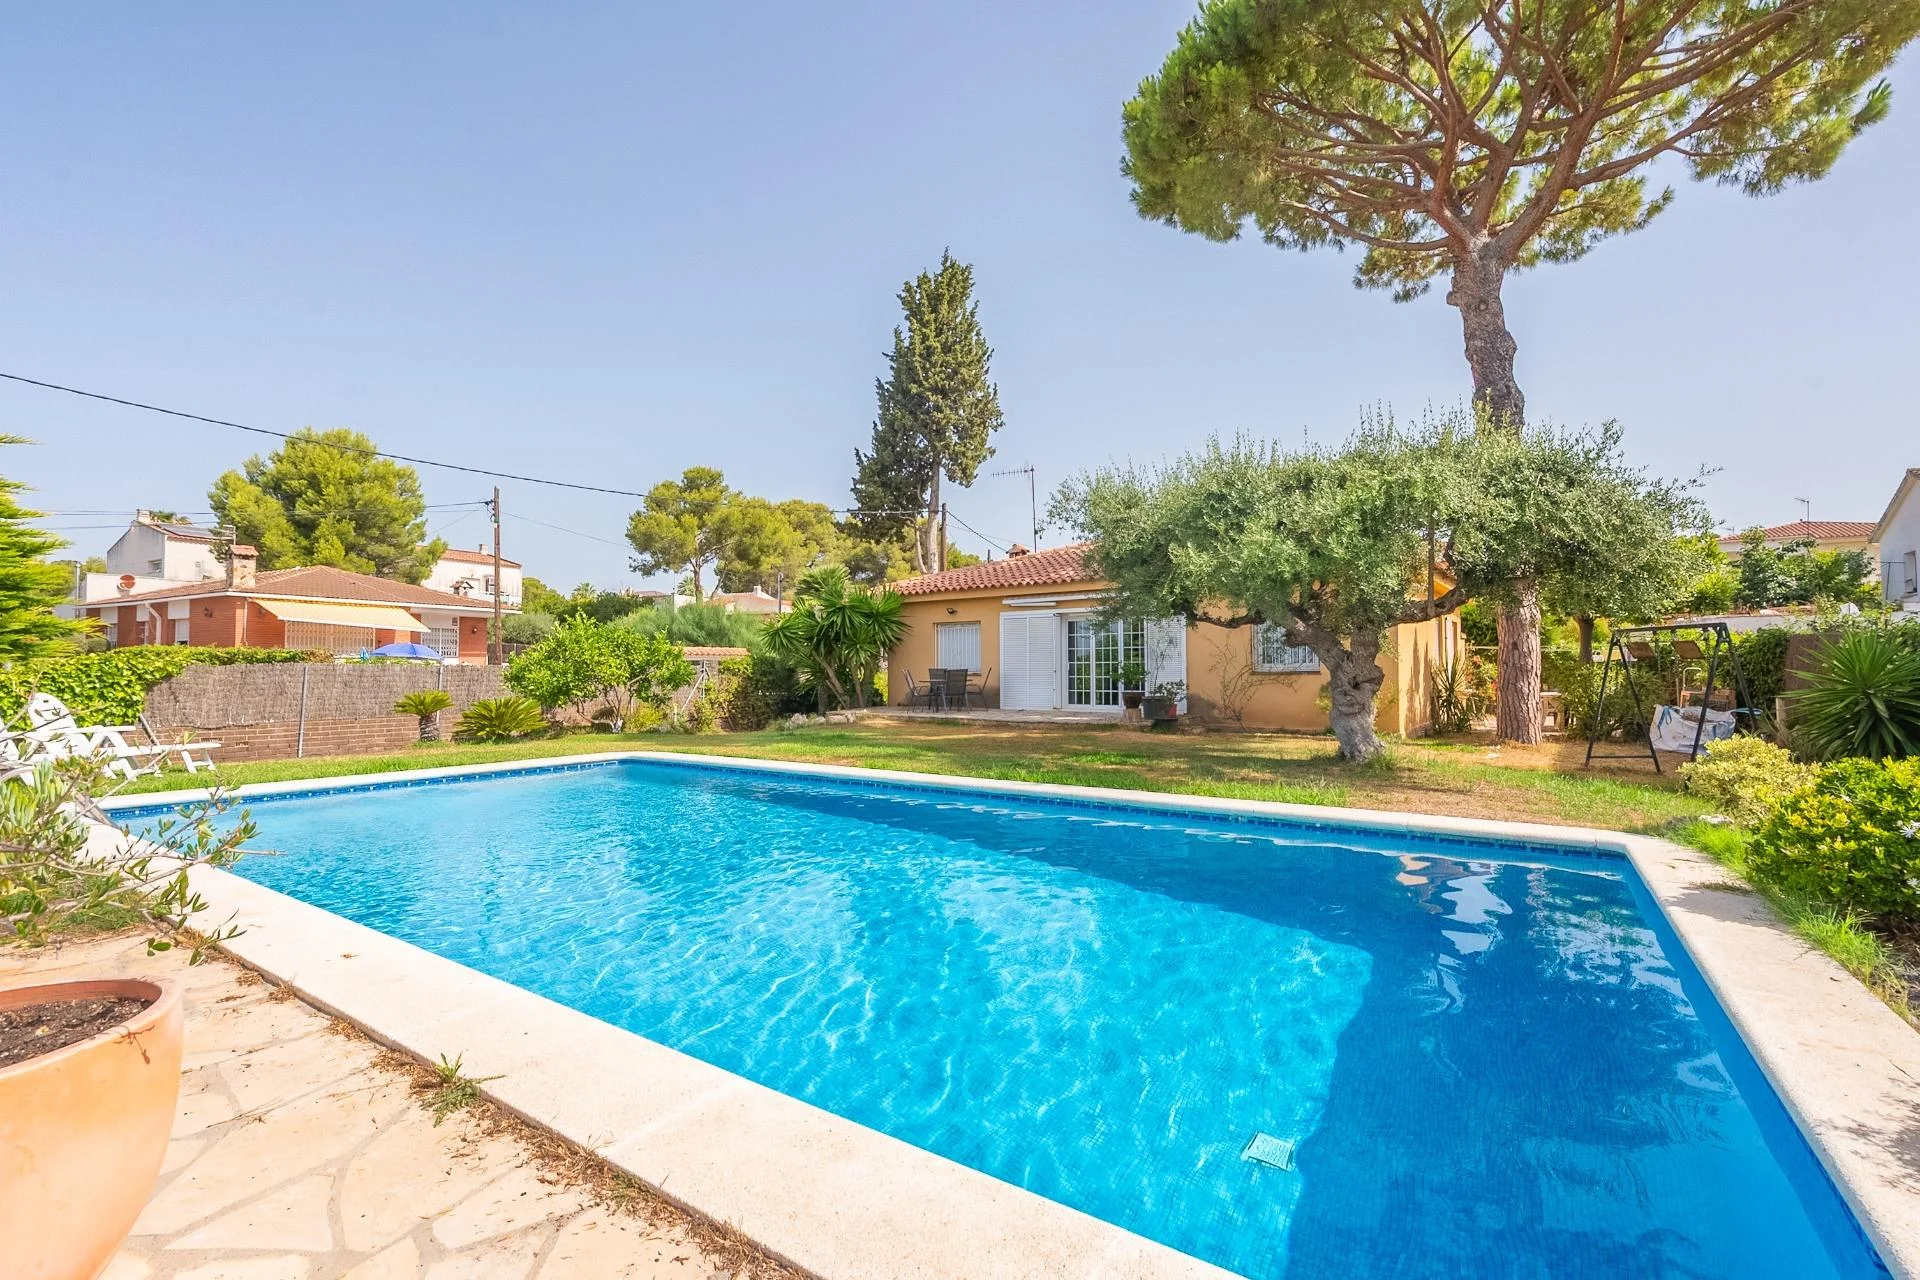
Single-storey Cunit chalet with pool
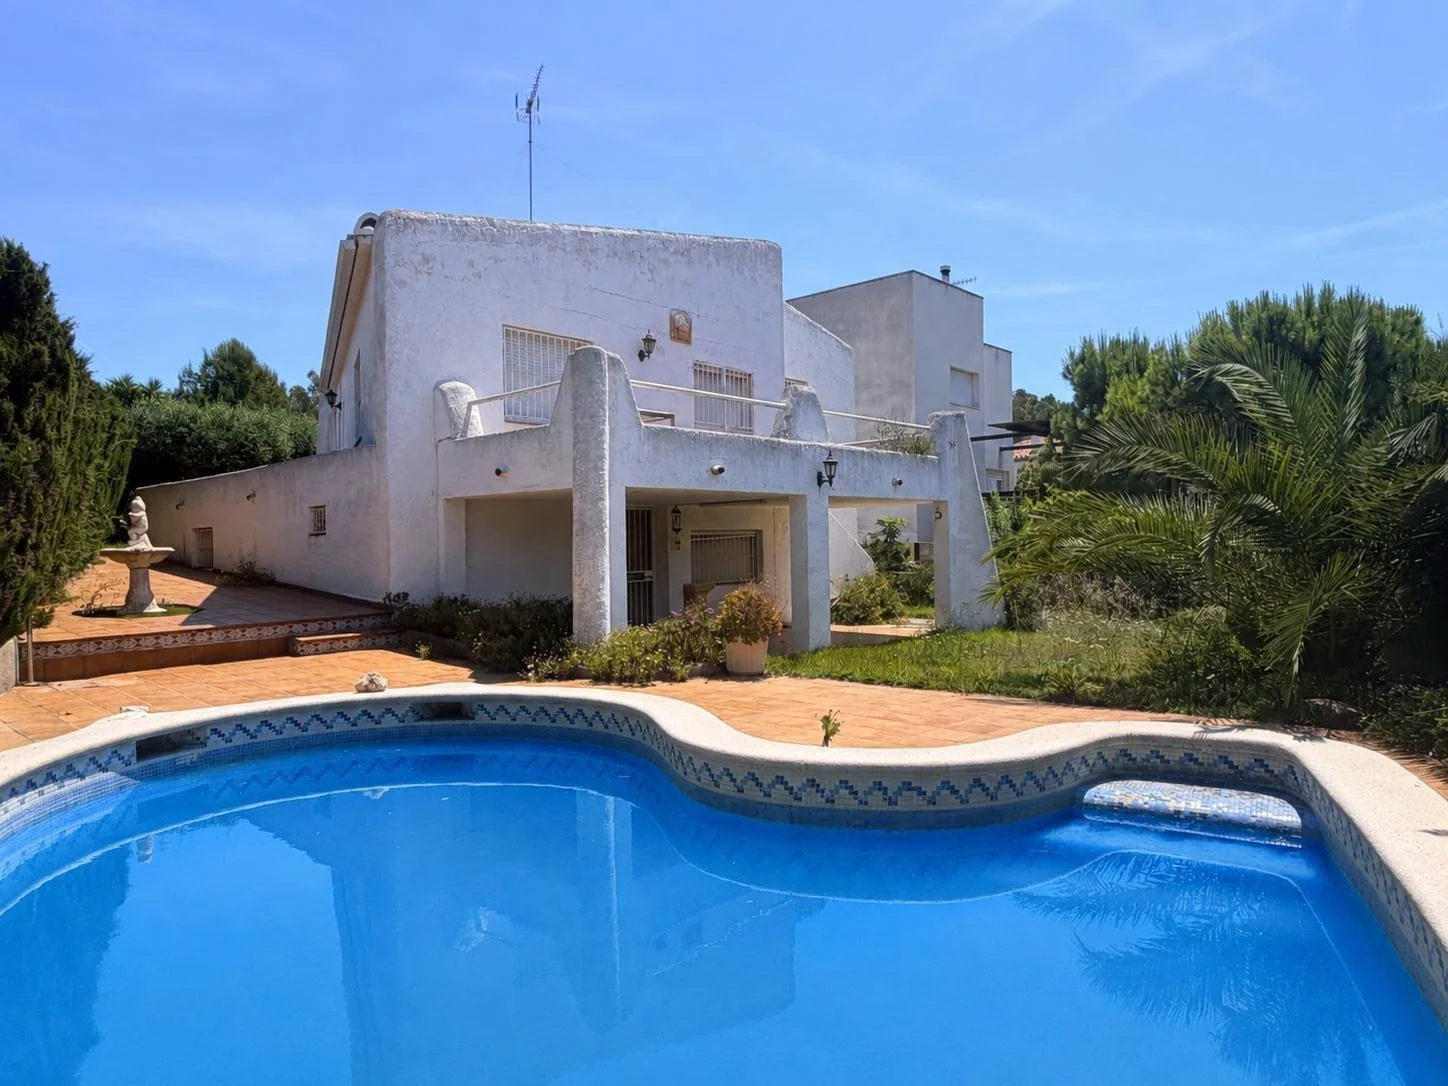
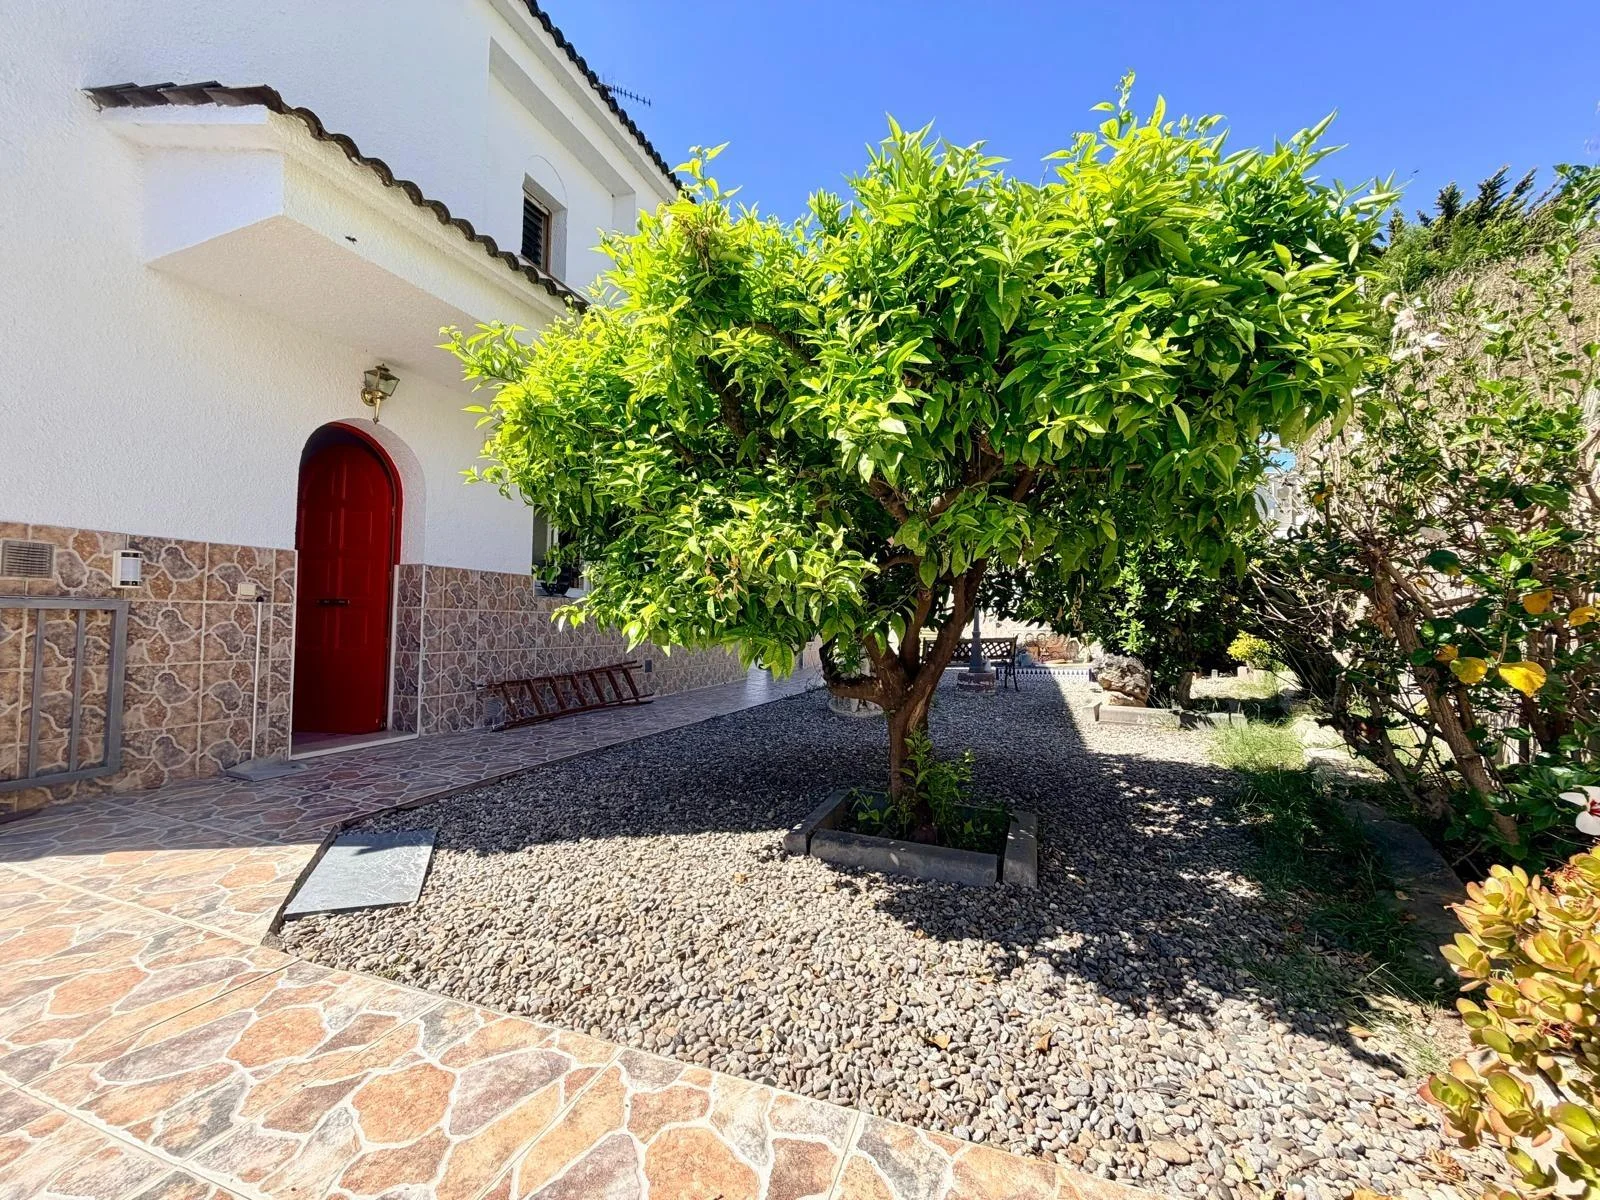
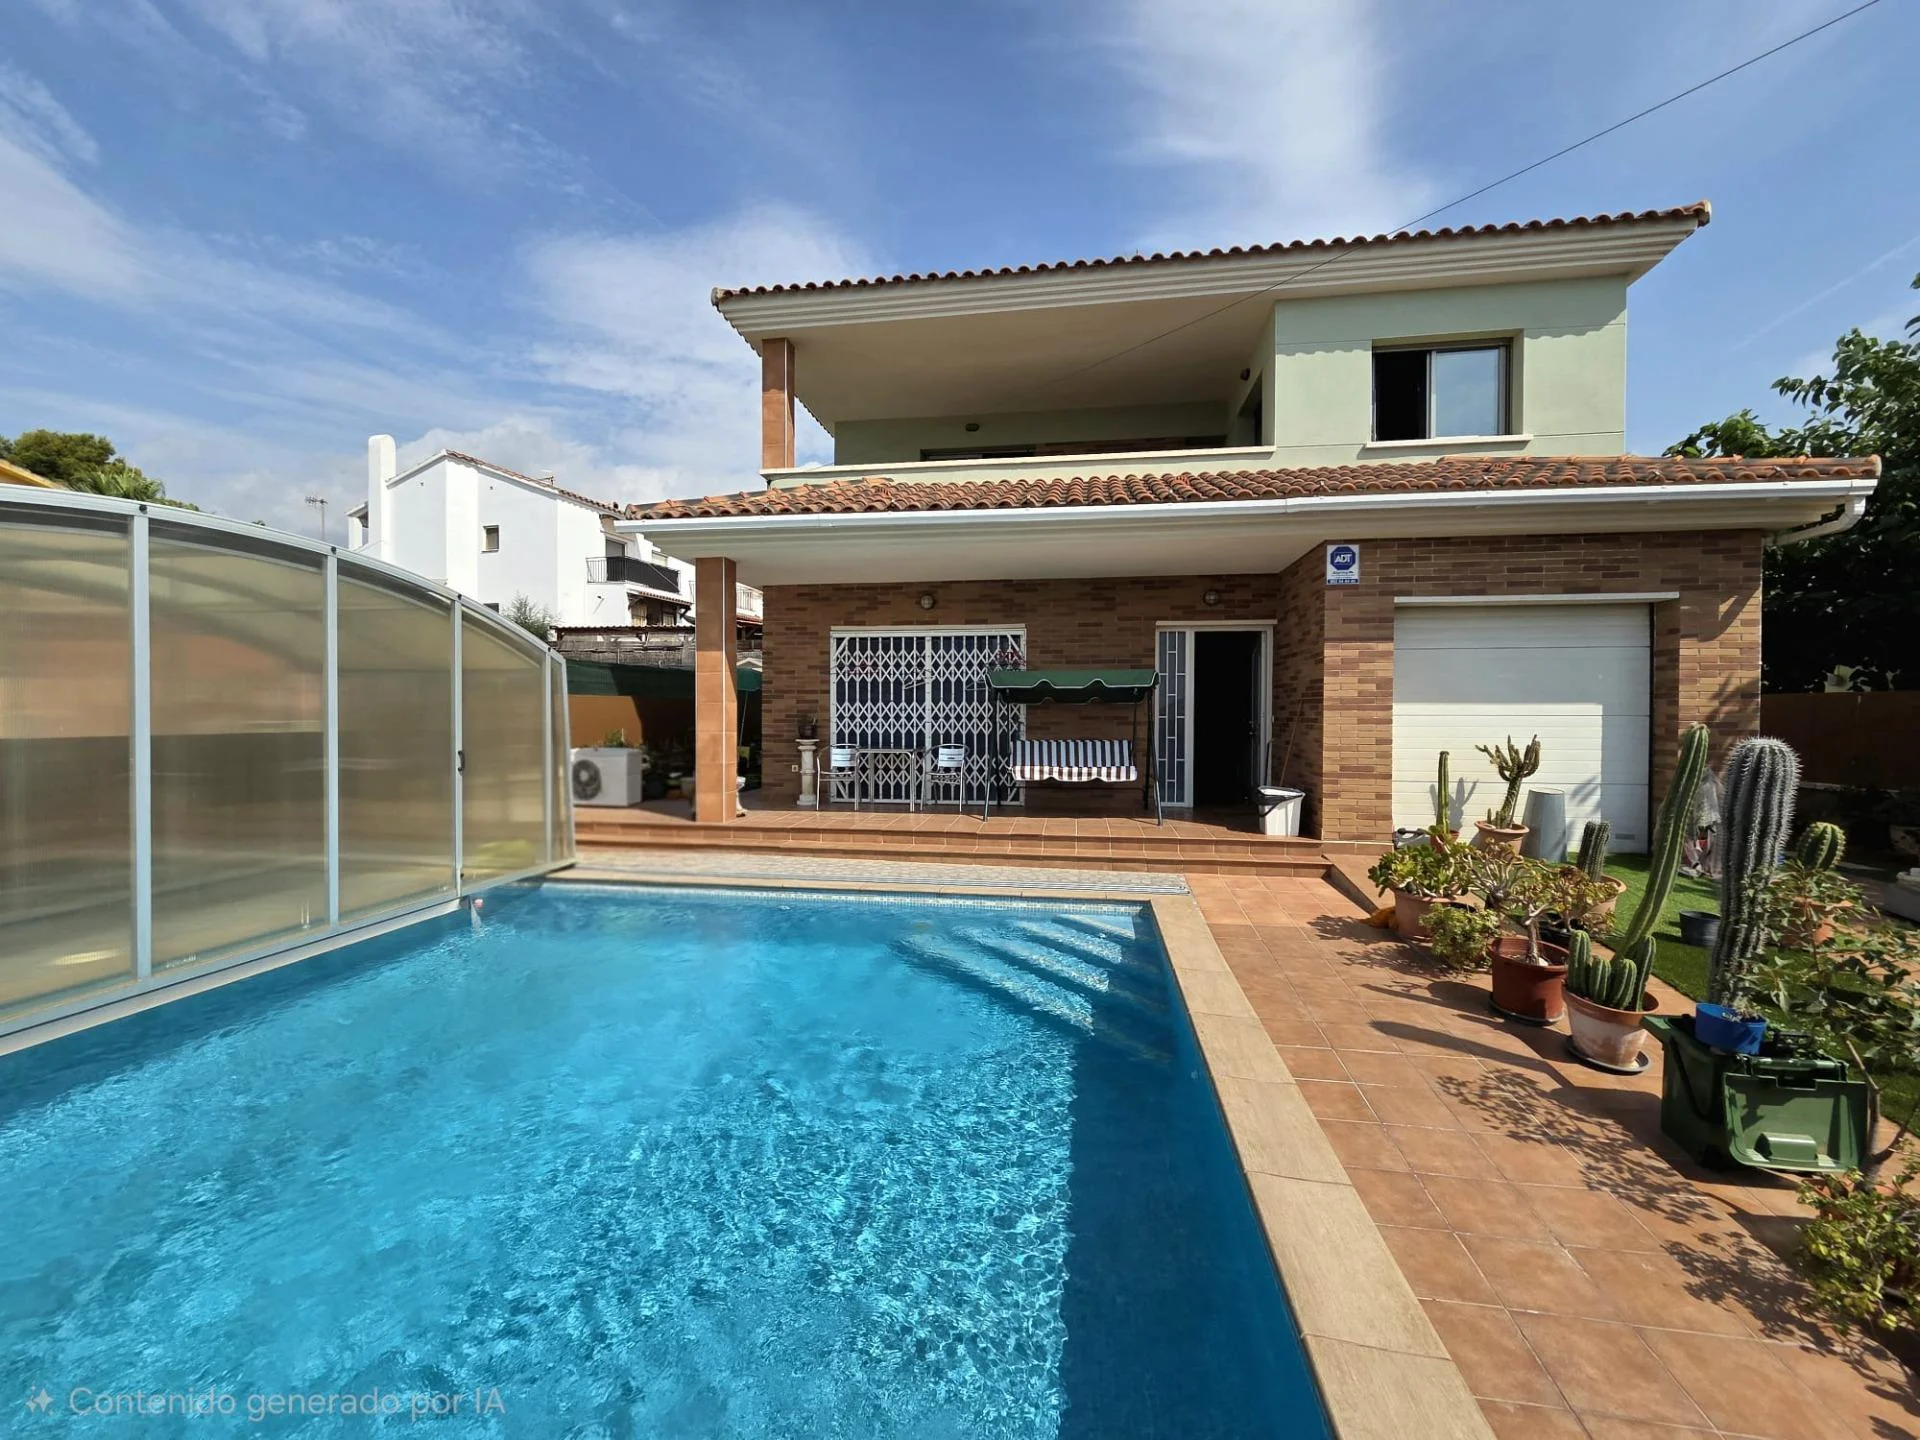
South-facing single-storey chalet in Cunit Residencial with four bedrooms, a private pool and parking for two cars. The listing describes a large garden plot, partial renovation needs and proximity to beaches, schools and transport.
Reference 002-CA · On Inmoblia since 5 September 2026 · Published by Fincas 2000
Specifications
What the advert says about the property: floor area, layout, condition and registry details.
We show the source-reported value for context, but exclude it from calculations until the conflicting evidence is resolved.
- Type
- Detached house
- Built area (source, uncertain)
- 167 m²
- Bedrooms
- 4
- Bathrooms
- 1
- Floors in the property
- 1
- Year built
- 1972
- Condition
- Needs renovation
- Occupancy
- Vacant
- Transaction type
- Full ownership
- Legal habitability
- Confirmed
- Aspect
- Exterior
- Orientation
- South
- Use / licence
- Other use
Fittings and extras
What the property comes with and how much each item weighs in the “Property data” sub-score.
- Heating +3
- Exterior-facing +4
- Pool
- Garden
- Parking 2 spaces +5
The advert also mentions:
- 50 m² private pool
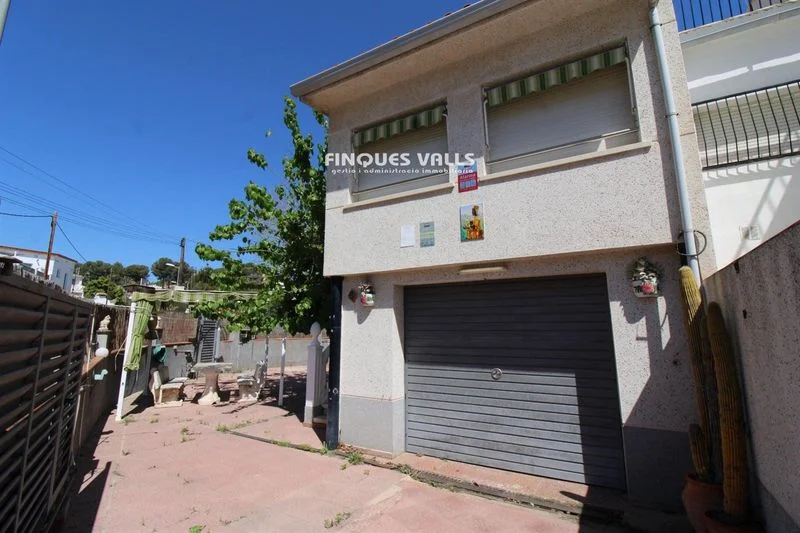
- 47 m² integrated parking area
- Gasoil central heating
- Chimney
- Automatic irrigation
- Built-in wardrobes
- Independent kitchen
- Pantry
- Porch with garden views
- Aluminium double-glazed windows
- Open views
- Fenced plot
Free text we could not normalise into a comparable attribute, so it does not score.
How these values score
What the analysis sees
The specific signals the model finds in this property and its municipality, before going into the score in detail.
In favour
- Ready to move intoFree of tenants: available to let from day one.
Against
No notable risks in the available data.
Municipal momentum
Where the local market is heading.
Rent price index
INE · 2011 base = 100 · yearly
Housing transactions
MIVAU · deals per year
Municipal demand
The structural depth of demand in the area.
Registered unemployment
SEPE · yearly average
Average gross income
AEAT · annual tax return
Registered population
INE · yearly population register
Net international migration
INE · immigration − emigration · yearly
Similar properties nearby
Real references of the same municipality and type, to cross-check rent and price. They are not necessarily active offers.
They sell for…
Comparable sales in Cunit, including those already sold.
This is a shortlisting pass over the advert's data, not a due diligence report. Before deciding, check the points we cannot verify from here:
- Possession: that it is vacant, with no squatters and no tenants on a live contract.
- If it is let, the current rent, the type of contract and its expiry date.
- The real state of repair and services (possible hidden renovation work) and a valid energy certificate.
- The real service charge and, above all, whether any special levies are approved or pending: they appear in the minutes of the last owners' meetings.
- The property's actual IBI: our figure is an estimate from the municipality's cadastral values, not the specific bill.
- Charges, mortgages, seizures or easements in the Land Registry extract.