
Blog
How a property investment is analysed with data
We write about what we do: where we find the inventory, how we turn a listing into comparable data, and how every figure we publish is calculated. No get-rich recipes, and the sources always in view.
4 articles
-
 Data
Data
Where our numbers come from: SERPAVI, the cadastre, the INE and four more sources
A portal's average price is computed over its own listings. We combine five independent signals per municipality, each weighted by the precision we've measured for it, and we publish the error of the result.
Read the article -
 Auctions
BOE auctions: the inventory no property portal lists
Property lots that appear on no portal are published in the BOE every day. The discount to market can be enormous, but it's only real if prior charges, possession and municipal liquidity line up. This is how we measure it.
Read the article -
 Yield
Yield
Gross vs. net rental yield: the calculation almost nobody does
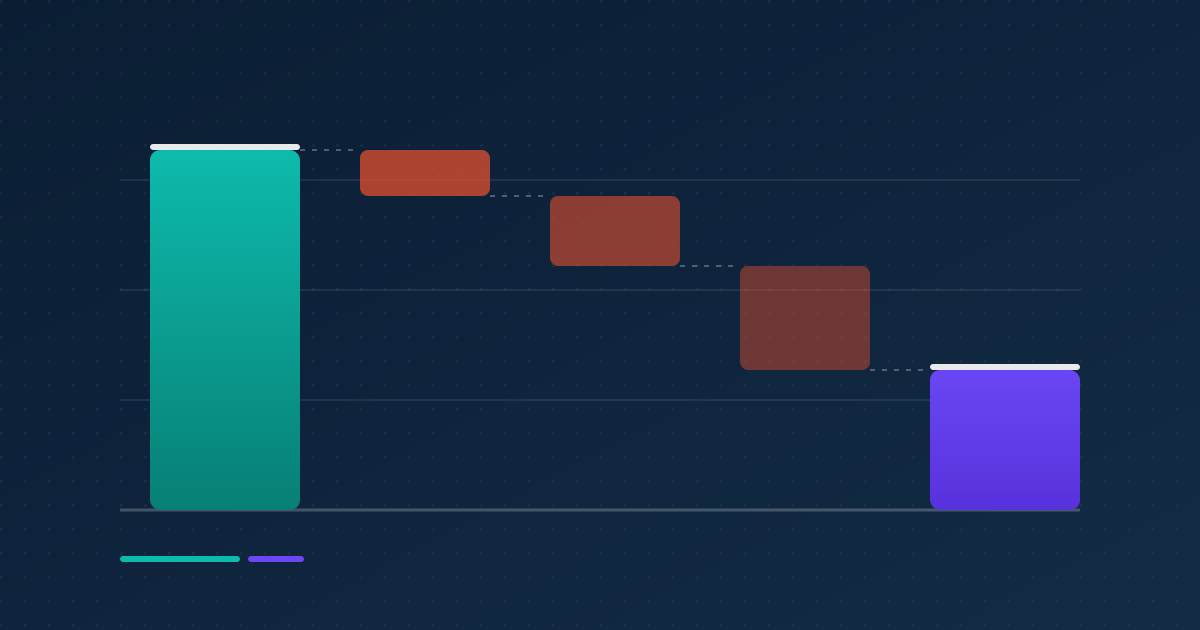
Dividing annual rent by the price is easy and misleading. These are the three costs that eat the difference, why the denominator is rarely the asking price, and how a 6.50% gross becomes a 4.88% net.
Read the article -
 How the market works
Why the best rental investment isn't on the portal you're searching
The big portals show what each agency pays to publish, in an order that is also paid for. The real inventory is larger, spread across thousands of agency websites. This is what shows up when you go and read it there.
Read the article