Checking the original advert…

Casco Antiguo · Talavera de la Reina · Toledo
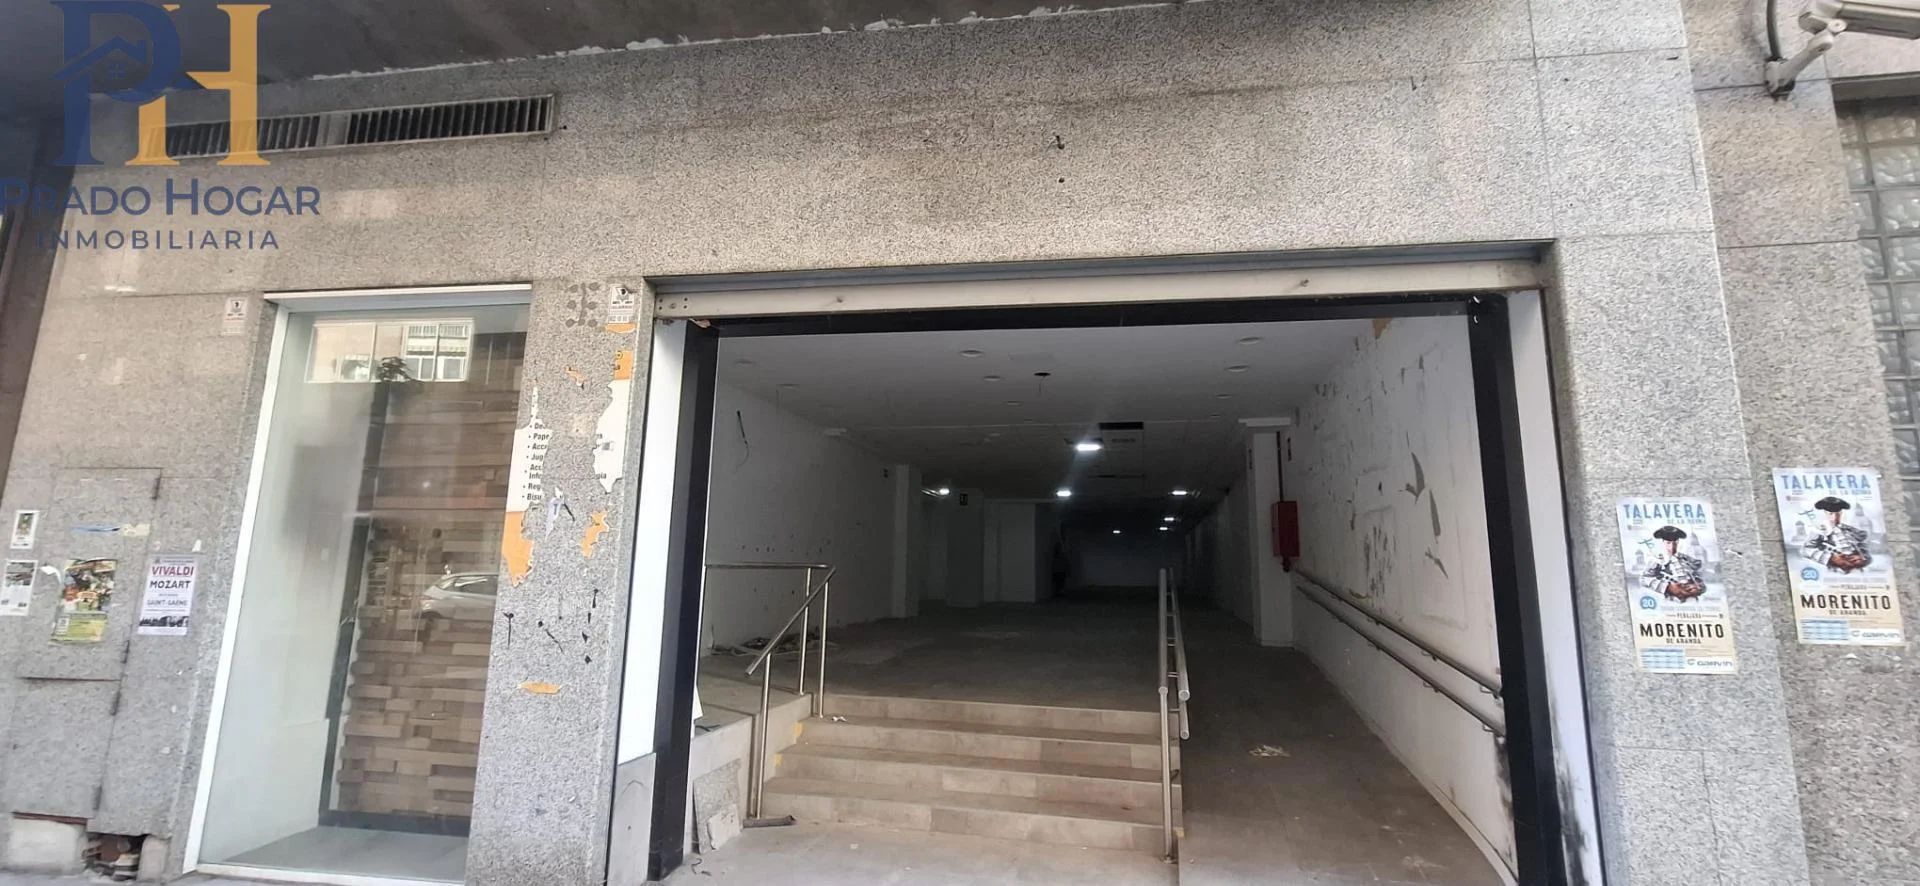
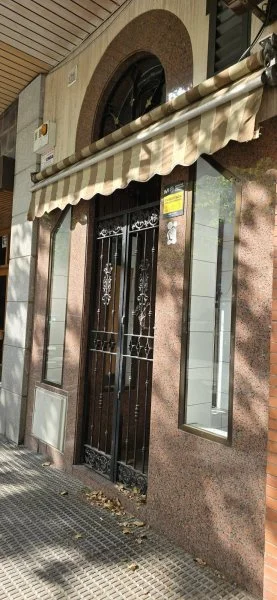
Ground-floor commercial unit in Casco Antiguo
45 m² unfinished commercial premises in Talavera de la Reina's Casco Antiguo, with smoke outlet and ground-floor street access. Suitable for commercial, storage or tavern use.
Reference 2548 · On Inmoblia since 5 September 2026 · Published by Construarca Inmobiliaria
Specifications
What the advert says about the property: floor area, layout, condition and registry details.
- Type
- Retail unit
- Built area
- 45 m²
- Bedrooms
- 1
- Condition
- Needs renovation
- Access
- Street level
Fittings and extras
What the property comes with and how much each item weighs in the “Property data” sub-score.
- Street level +15
- Smoke outlet +8
The advert also mentions:
- Suitable for tavern use
- Commercial or storage use permitted
Free text we could not normalise into a comparable attribute, so it does not score.
How these values score
Municipal momentum
Where the local market is heading.
Rent price index
INE · 2011 base = 100 · yearly
Housing transactions
MIVAU · deals per year
These series describe the municipality's housing market; for this asset they are context for the area, not for its own segment.
Municipal demand
The structural depth of demand in the area.
Registered unemployment
SEPE · yearly average
Average gross income
AEAT · annual tax return
Registered population
INE · yearly population register
Net international migration
INE · immigration − emigration · yearly
Recorded offences
Ministry of the Interior · cumulative
Recorded offences (municipalities over 20,000 residents only, from 2024) are territorial context: they do not label an area “safe” or “unsafe”, nor do they measure tenant risk.
Similar properties nearby
Real references of the same municipality and type, to cross-check rent and price. They are not necessarily active offers.
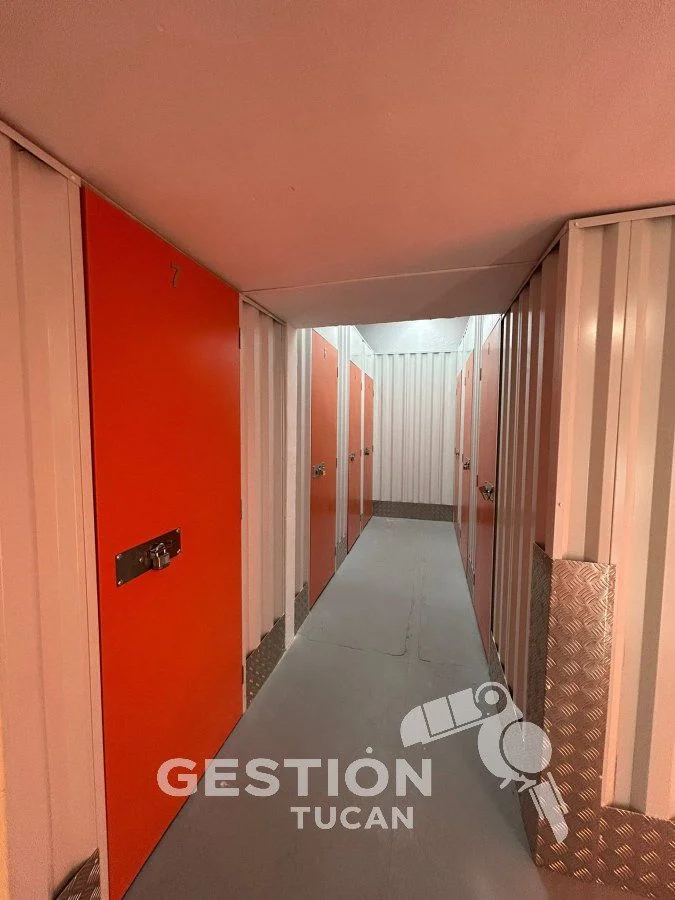
They let for…
Comparable rentals in Talavera de la Reina, including those already let.

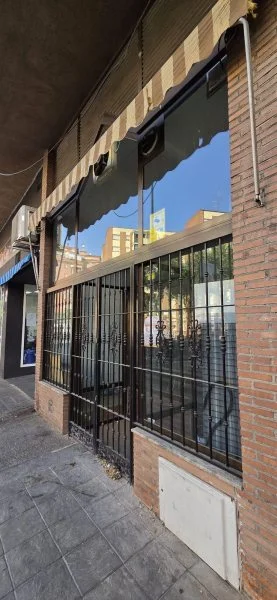
They sell for…
Comparable sales in Talavera de la Reina, including those already sold.

This is a shortlisting pass over the advert's data, not a due diligence report. Before deciding, check the points we cannot verify from here:
- The activity licence granted and the uses planning permits for your intended activity.
- Smoke outlet and ventilation if it is destined for hospitality, and the contracted electrical capacity.
- Whether it is a sale, a leasehold transfer or a rental, the current tenancy position and the cost of fitting-out works.
- The real service charge and, above all, whether any special levies are approved or pending: they appear in the minutes of the last owners' meetings.
- The property's actual IBI: our figure is an estimate from the municipality's cadastral values, not the specific bill.
- Charges, mortgages, seizures or easements in the Land Registry extract.