
Data updated on 3 September 2026Data updated: 3 Sept 2026
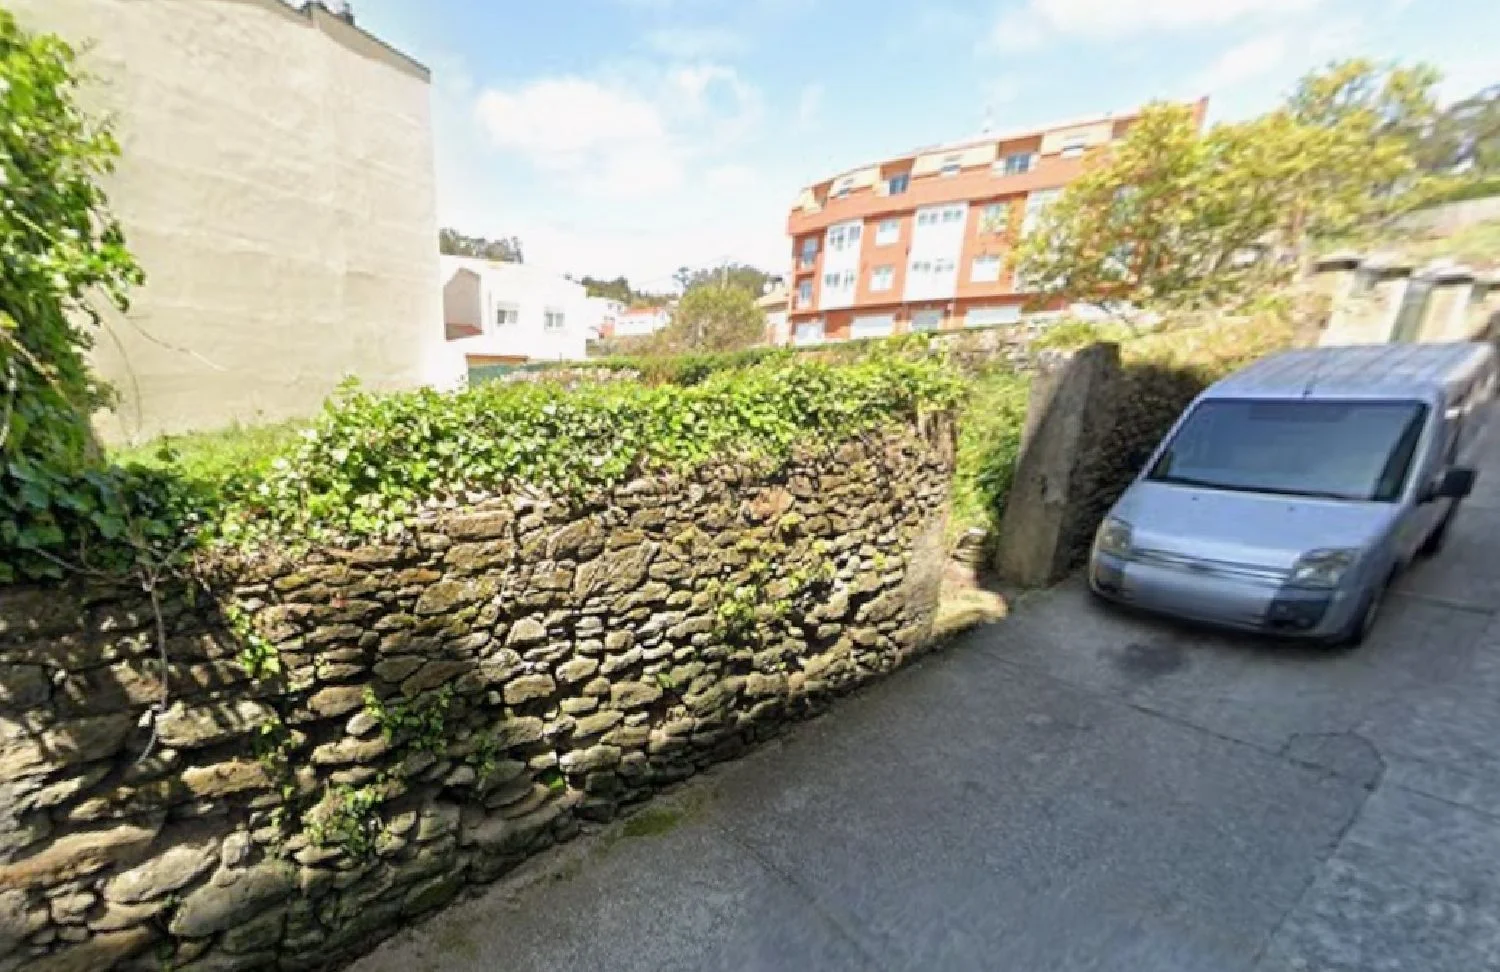
Agra Rodríguez, Corme · Ponteceso · A Coruña
Urban development plot in Corme
373 m² urban plot with approximately 200 m² estimated buildable area. Pending special planning development, with the parcel representing approximately 55% of the sector.
Reference 4186 · On Inmoblia since 3 September 2026 · Published by Metropoli Servicios
Specifications
What the advert says about the property: floor area, layout, condition and registry details.
We show the source-reported value for context, but exclude it from calculations until the conflicting evidence is resolved.
- Type
- Land
- Plot
- 373 m²
- Land classification
- Urban land
Fittings and extras
What the property comes with and how much each item weighs in the “Property data” sub-score.
- Utilities at the plot boundary +8
The advert also mentions:
- Residential use
- APR-D1.2 Travesía da Agra Leste sector
- Maximum height of ground floor plus two levels
- Compact block housing typology
- Pending special planning development
- Compensation management system
- Majority position for advancing the planning process
- Near the port and beaches
- Costa da Morte setting
Free text we could not normalise into a comparable attribute, so it does not score.
How these values score
No buy-to-let analysis
This is a plot of land: it produces no rental income, so we calculate no yield, no rental mortgage and no buy-to-let score. Below you will find the municipal context and the plot's details.
Municipal momentum
Where the local market is heading.
Housing transactions
MIVAU · deals per year
These series describe the municipality's housing market; for this asset they are context for the area, not for its own segment.
Municipal demand
The structural depth of demand in the area.
Registered unemployment
SEPE · yearly average
Average gross income
AEAT · annual tax return
Registered population
INE · yearly population register
Net international migration
INE · immigration − emigration · yearly
This is a shortlisting pass over the advert's data, not a due diligence report. Before deciding, check the points we cannot verify from here:
- Planning classification and real buildable area: confirm both with the town hall before anything else.
- Available services and connections (water, electricity, drainage, vehicle access).
- The real service charge and, above all, whether any special levies are approved or pending: they appear in the minutes of the last owners' meetings.
- The property's actual IBI: our figure is an estimate from the municipality's cadastral values, not the specific bill.
- Charges, mortgages, seizures or easements in the Land Registry extract.