
Data updated on 3 September 2026Data updated: 3 Sept 2026
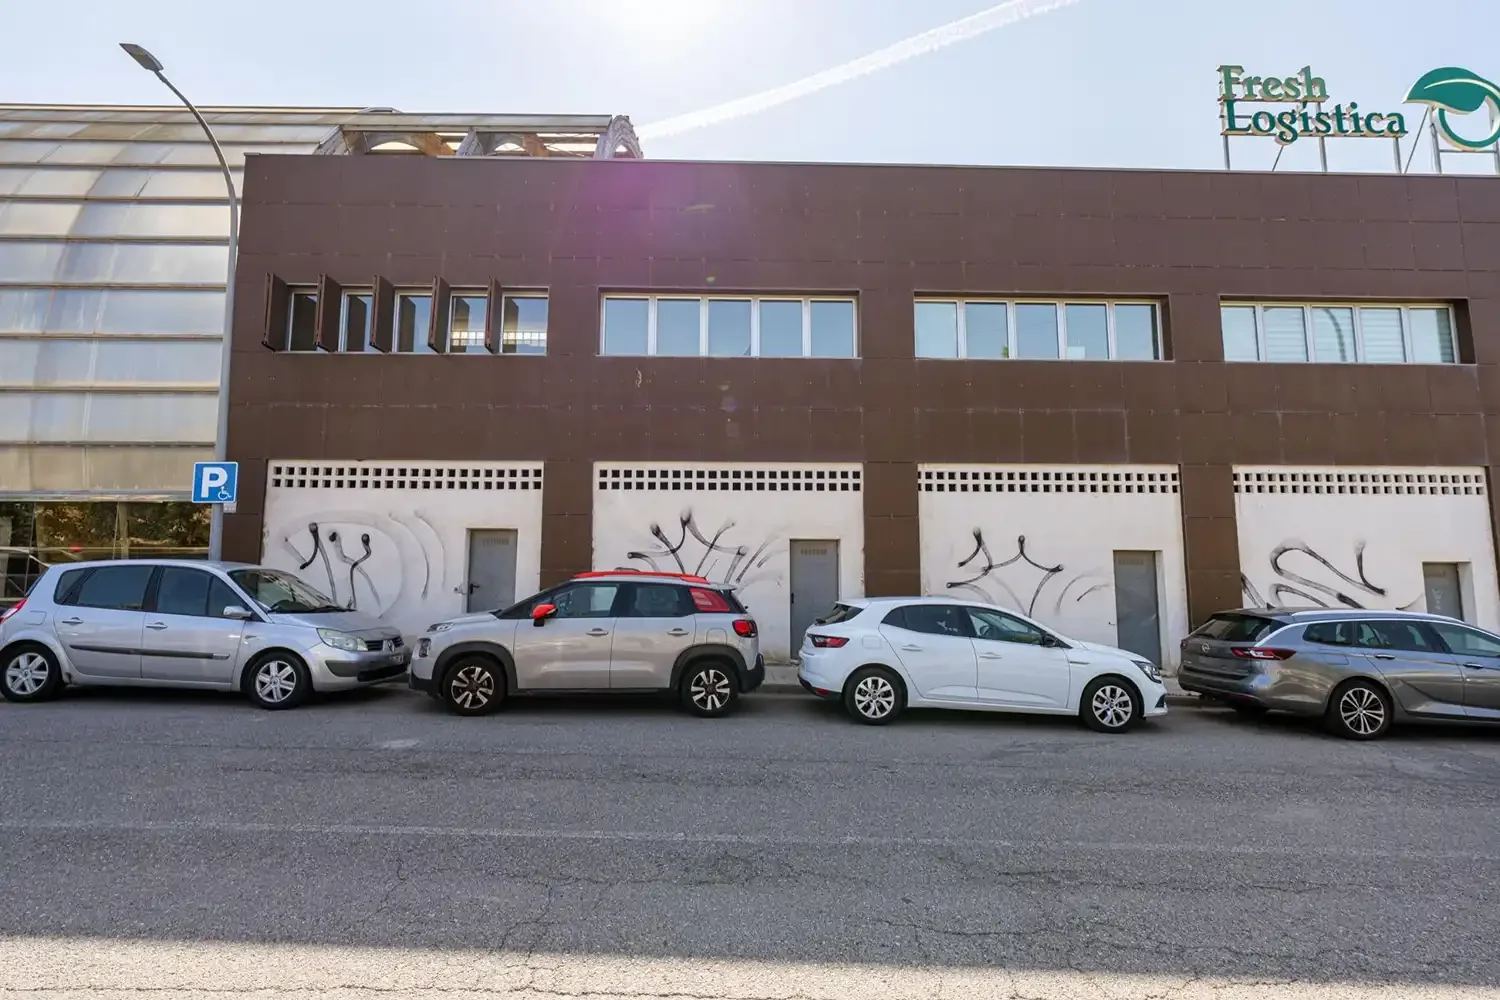
Polígono Venta Alegre · Huércal de Almería · Almería
Three flexible commercial units, 411 m²
Three unfinished commercial units in Huércal de Almería, with 411 m² of stated usable area and adaptable layouts. They can be rented together or separately for retail, offices, academies, clinics, gyms or hospitality.
Reference KC01539 · On Inmoblia since 3 September 2026 · Published by Look And Find Almeria
Specifications
What the advert says about the property: floor area, layout, condition and registry details.
We show the source-reported value for context, but exclude it from calculations until the conflicting evidence is resolved.
- Type
- Retail unit
- Floor
- 1
- Year built
- 2009
- Condition
- Needs renovation
- Orientation
- West
Fittings and extras
What the property comes with and how much each item weighs in the “Property data” sub-score.
The advert also mentions:
- Three commercial units offered together
- Two units of 145 m² each
- One unit of 115 m² with a 20 m² patio
- Units can be rented separately or combined
- Unfinished premises ready for full customization
- Street visibility on José Gaos
- Suitable for retail, offices, academies, clinics, gyms or hospitality
- Expanding commercial area
- Five minutes from Almería city
- Good access and transport links
- Patio
Free text we could not normalise into a comparable attribute, so it does not score.
Municipal momentum
Where the local market is heading.
Rent price index
INE · 2011 base = 100 · yearly
Housing transactions
MIVAU · deals per year
These series describe the municipality's housing market; for this asset they are context for the area, not for its own segment.
Municipal demand
The structural depth of demand in the area.
Registered unemployment
SEPE · yearly average
Average gross income
AEAT · annual tax return
Registered population
INE · yearly population register
Net international migration
INE · immigration − emigration · yearly
This is a shortlisting pass over the advert's data, not a due diligence report. Before deciding, check the points we cannot verify from here:
- The activity licence granted and the uses planning permits for your intended activity.
- Smoke outlet and ventilation if it is destined for hospitality, and the contracted electrical capacity.
- Whether it is a sale, a leasehold transfer or a rental, the current tenancy position and the cost of fitting-out works.
- The real service charge and, above all, whether any special levies are approved or pending: they appear in the minutes of the last owners' meetings.
- The property's actual IBI: our figure is an estimate from the municipality's cadastral values, not the specific bill.
- Charges, mortgages, seizures or easements in the Land Registry extract.