
Checking the original advert…
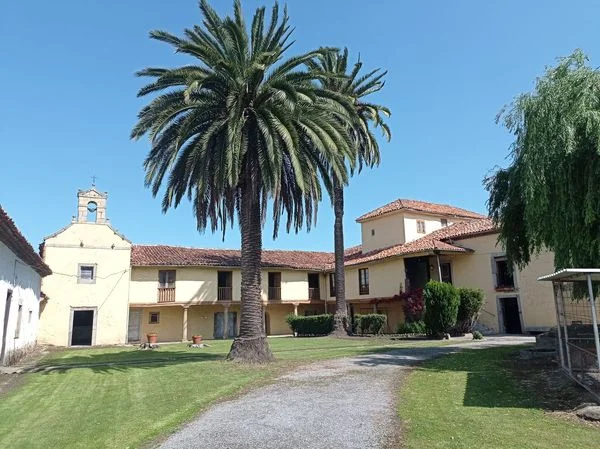
Barrio Palacio · Carreño · Asturias
Historic Carreño palace with redevelopment potential
1,888 m² mixed-use historic building on a 5,300 m² enclosed estate, with 10 bedrooms, two bathrooms and extensive restoration potential for hospitality, events or cultural use.
Reference VE0007 · On Inmoblia since 2 September 2026 · Published by Alonso Y Asociados Gestión Inmobiliaria
Specifications
What the advert says about the property: floor area, layout, condition and registry details.
- Type
- Building
- Built area
- 1,888 m²
- Plot
- 5,300 m²
- Bedrooms
- 10
- Bathrooms
- 2
- Floors in the property
- 2
- Year built
- 1900
- Condition
- Needs renovation
- Occupancy
- Vacant
- Energy certificate
- Exempt
Fittings and extras
What the property comes with and how much each item weighs in the “Property data” sub-score.
- Parking 2 spaces
The advert also mentions:
- 18th-century Asturian palace architecture
- Listed in the Asturian historic buildings heritage catalogue
- Enclosed estate arranged around a central courtyard
- Main residence with large salons and a kitchen-dining room
- Traditional Asturian granary
- Private chapel dedicated to Our Lady of Carmen
- Agricultural outbuildings
- Original metal-studded entrance door
- Large stone staircase
- Wooden corridor with windows
- Potential for boutique hotel or rural tourism
- Potential for weddings and events venue
Free text we could not normalise into a comparable attribute, so it does not score.
What the analysis sees
The specific signals the model finds in this property and its municipality, before going into the score in detail.
In favour
- Ready to move intoFree of tenants: available to let from day one.
Against
No notable risks in the available data.
Municipal momentum
Where the local market is heading.
Rent price index
INE · 2011 base = 100 · yearly
Housing transactions
MIVAU · deals per year
These series describe the municipality's housing market; for this asset they are context for the area, not for its own segment.
Municipal demand
The structural depth of demand in the area.
Registered unemployment
SEPE · yearly average
Average gross income
AEAT · annual tax return
Registered population
INE · yearly population register
Net international migration
INE · immigration − emigration · yearly
This is a shortlisting pass over the advert's data, not a due diligence report. Before deciding, check the points we cannot verify from here:
- The real service charge and, above all, whether any special levies are approved or pending: they appear in the minutes of the last owners' meetings.
- The property's actual IBI: our figure is an estimate from the municipality's cadastral values, not the specific bill.
- Charges, mortgages, seizures or easements in the Land Registry extract.