La Gallega · Santa Cruz de Tenerife · Santa Cruz de Tenerife · 38107
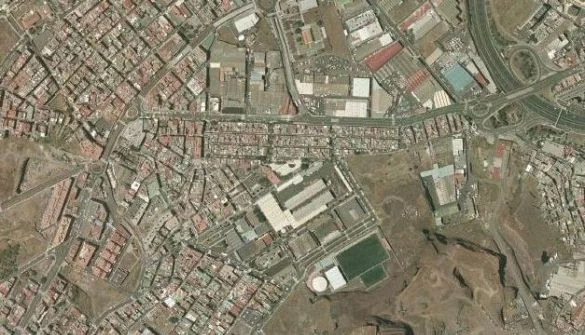
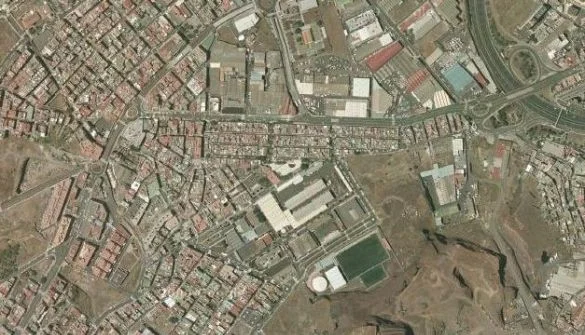
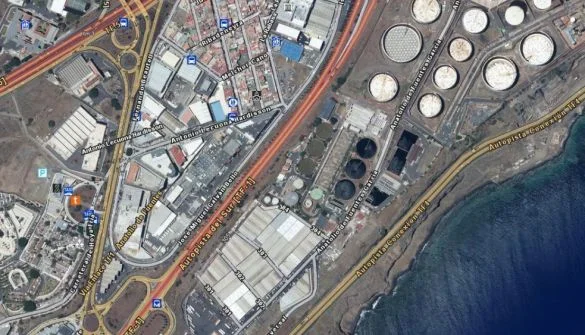
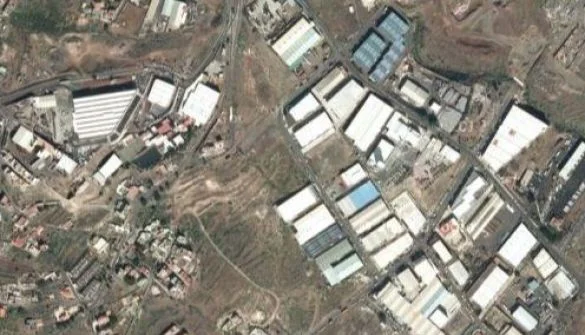
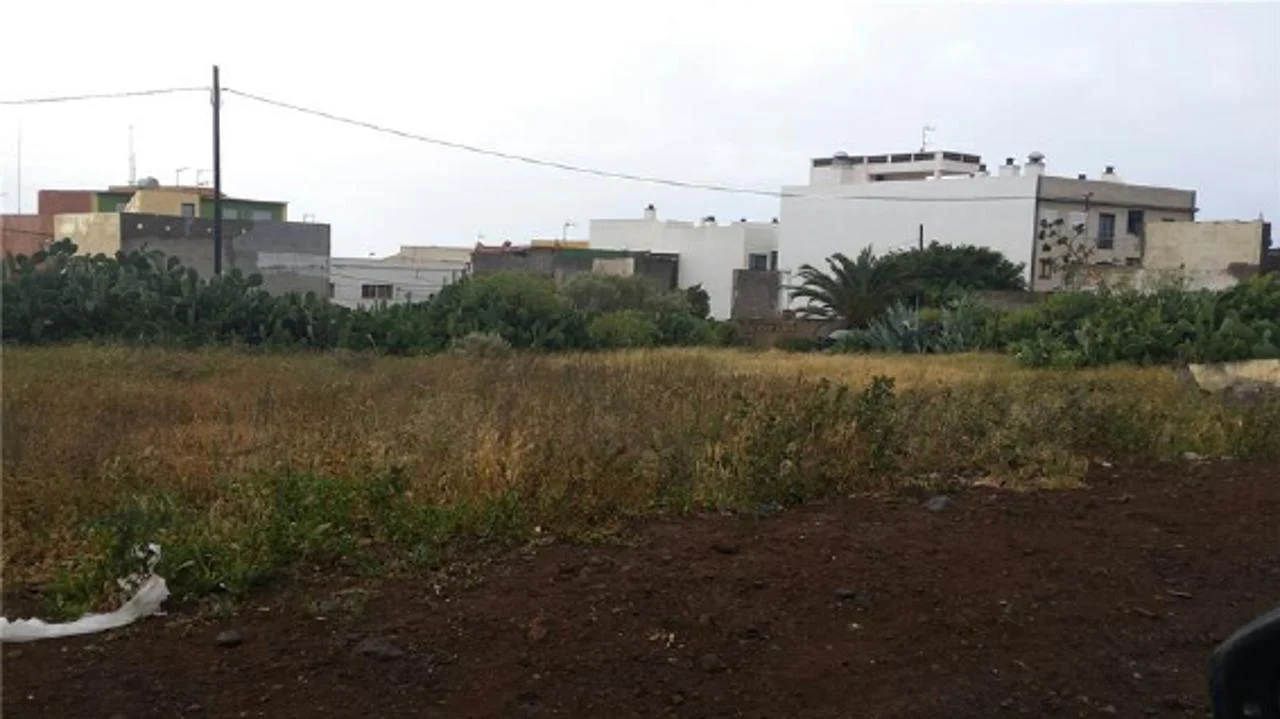
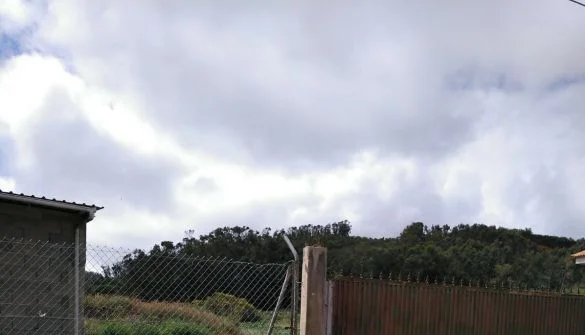
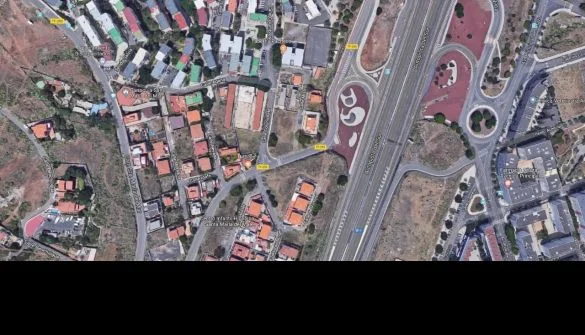
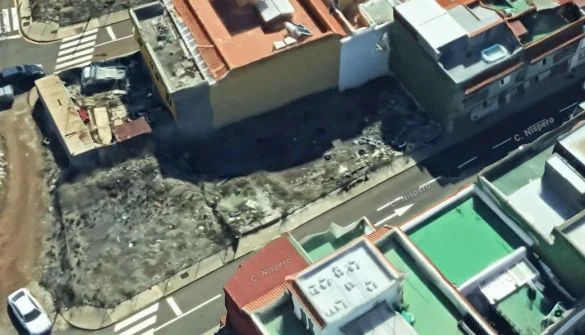
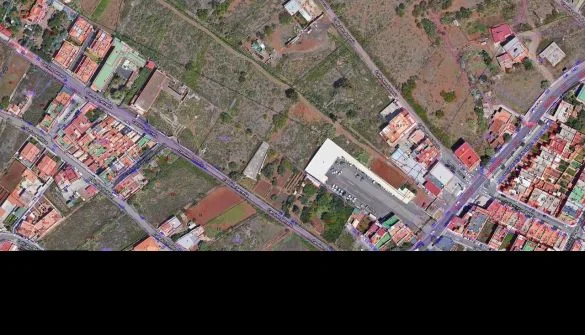
Urban plot in La Gallega, 760 m²
€298,500
Urban plot in La Gallega, Santa Cruz de Tenerife, with 760 m² of stated usable area.
Reference 438 · On Inmoblia since 31 August 2026 · Published by Miropiso
The property
Specifications
What the advert says about the property: floor area, layout, condition and registry details.
Type
Land
Usable area
760 m²
Land classification
Urban land
No buy-to-let analysis
This is a plot of land: it produces no rental income, so we calculate no yield, no rental mortgage and no buy-to-let score. Below you will find the municipal context and the plot's details.
Municipal momentum
Where the local market is heading.
Rent price index
INE · 2011 base = 100 · yearly
+4.4% interanual
Housing transactions
MIVAU · deals per year
+15.0% interanual
These series describe the municipality's housing market; for this asset they are context for the area, not for its own segment.
0 = flataverage annual growth of the municipal rent index (INE)
10%Unemployment rate (approx.)
median 10%unemployed over unemployed + social security contributors (a proxy comparable across municipalities)
+8.5‰Net migration
median 11.9‰arrivals minus departures from abroad per 1,000 residents · a growing population sustains demand
Registered unemployment
SEPE · yearly average
−5.0% interanual
Average gross income
AEAT · annual tax return
+3.8% interanual
Registered population
INE · yearly population register
0.0% interanual
Net international migration
INE · immigration − emigration · yearly
−14.0% interanual
Recorded offences
Ministry of the Interior · cumulative
+85.8% interanual
Recorded offences (municipalities over 20,000 residents only, from 2024) are territorial context: they do not label an area “safe” or “unsafe”, nor do they measure tenant risk.
Comparables
Similar properties nearby
Real references of the same municipality and type, to cross-check rent and price. They are not necessarily active offers.
They let for…
Comparable rentals in Santa Cruz de Tenerife, including those already let.
This is a shortlisting pass over the advert's data, not a due diligence report. Before deciding, check the points we cannot verify from here:
Planning classification and real buildable area: confirm both with the town hall before anything else.
Available services and connections (water, electricity, drainage, vehicle access).
The real service charge and, above all, whether any special levies are approved or pending: they appear in the minutes of the last owners' meetings.
The property's actual IBI: our figure is an estimate from the municipality's cadastral values, not the specific bill.
Charges, mortgages, seizures or easements in the Land Registry extract.
Context for the AI
Loading the context…
Cookies on inmoblia
We use technical cookies needed for the site to work and, only if you accept, Google Analytics cookies to measure how many people visit it. If you reject them, they are neither set nor loaded. You can change your mind whenever you like.
Choose which cookies you allow. Technical ones cannot be switched off, because without them the site cannot deliver what you asked for.
Technical (necessary)Always on
They remember the language you chose, your decision on these cookies and, in future, your signed-in session. Exempt from consent under article 22.2 LSSI.
Google Analytics 4, with anonymised IP and no advertising use. They tell us which pages get read and which do not. Off by default.