
Checking the original advert…
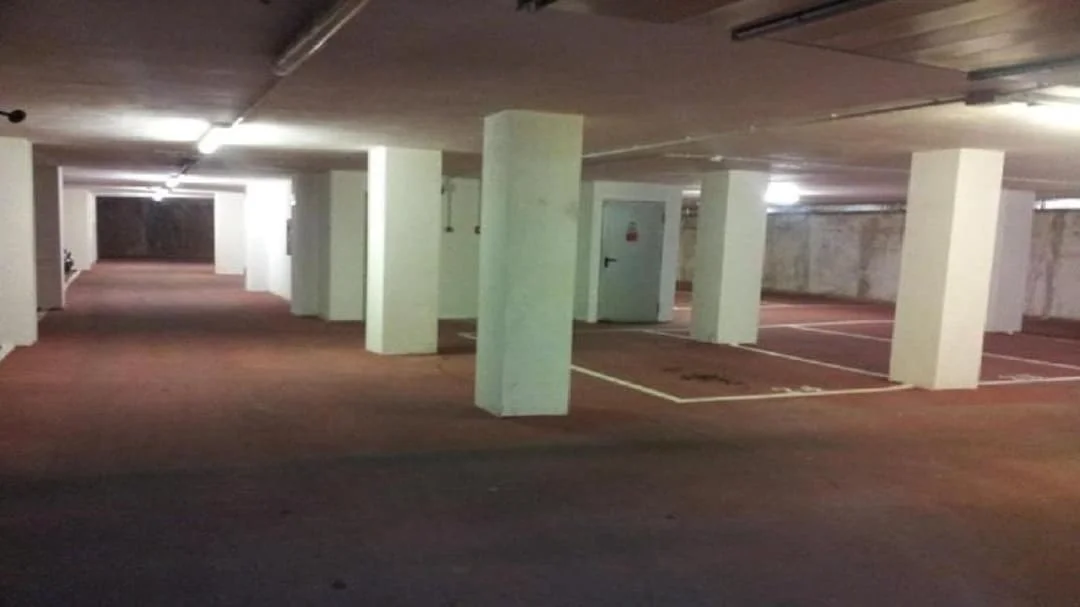
Centre · Cornellà de Llobregat · Barcelona
Central Cornellà garage, 46 m²
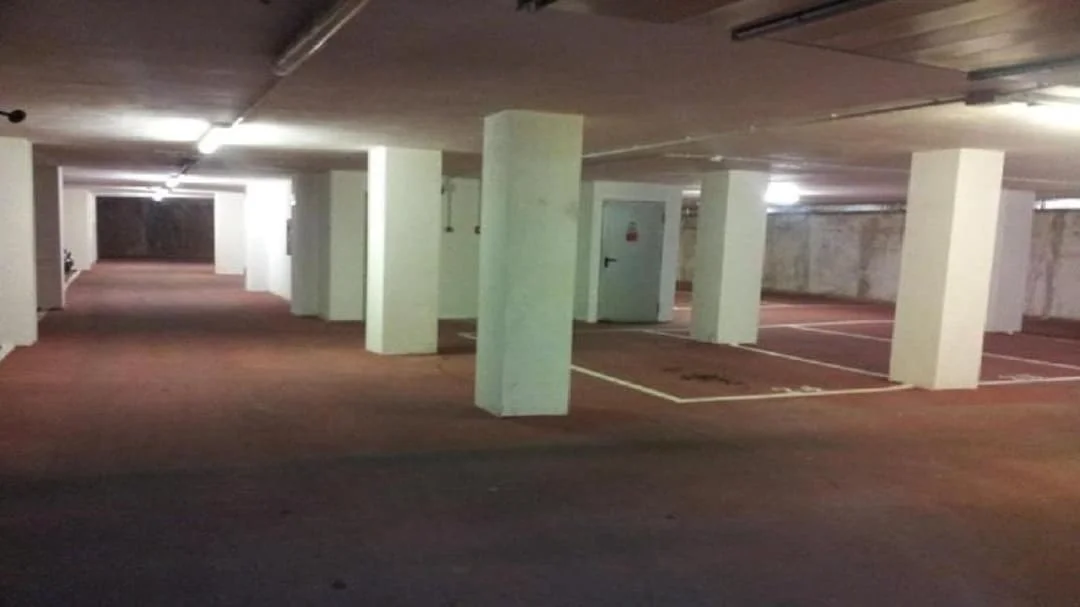
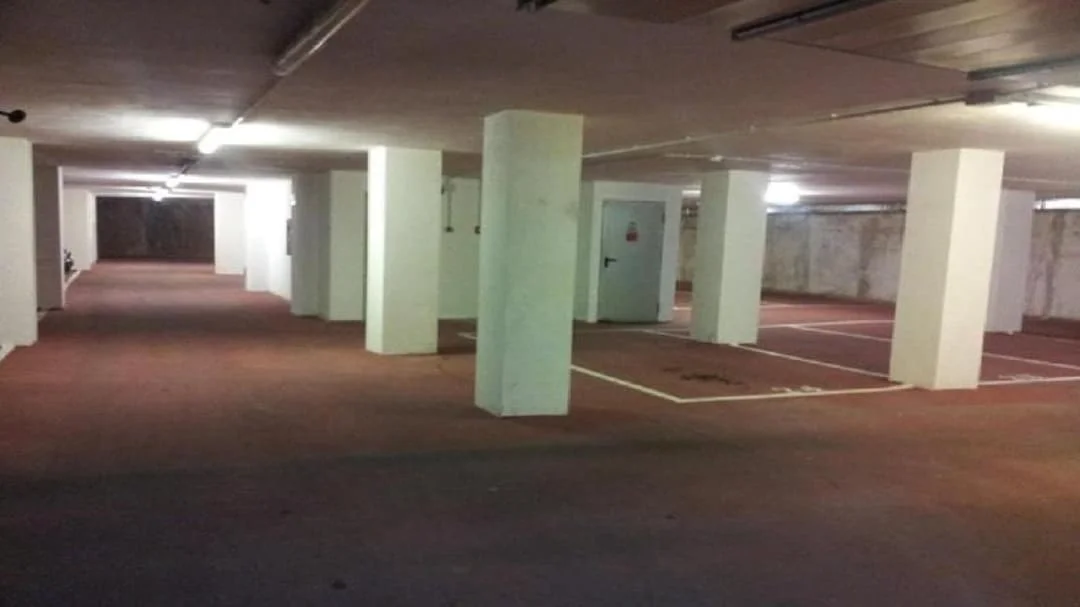
46 m² garage with one parking space on the seventh floor, centrally located in Cornellà de Llobregat with access to public transport and Ronda de Dalt.
Estimated monthly account
Estimated up-front investment €3,255 · 20% deposit + 11% purchase costs
Reference srb0000812318 · On Inmoblia since 18 August 2026 · Published by Aliseda
Specifications
What the advert says about the property: floor area, layout, condition and registry details.
- Type
- Garage
- Built area
- 46 m²
- Floor
- 7a
Fittings and extras
What the property comes with and how much each item weighs in the “Property data” sub-score.
- Parking 1 space
The advert also mentions:
- Near Parc de Can Mercader
- Nearby shops and services
- Nearby metro and train stations
- Easy access to Ronda de Dalt
Free text we could not normalise into a comparable attribute, so it does not score.
What the analysis sees
The specific signals the model finds in this property and its municipality, before going into the score in detail.
In favour
- Growing populationThe municipality has a positive net international migration balance: incoming population sustains rental demand.
- High net yieldThe estimated rent leaves a net margin above the market average.
Against
- Rent estimated from our own comparablesNo official SERPAVI reference for this class; we use our own sample of rental adverts.
- Non-local rent benchmarkThere are not enough comparables of this class in the municipality, so the rent rests on the provincial or national benchmark.
- Thin rent sampleThe rent estimate comes from few comparables.
How the score is built
The overall score is the weighted sum of six factors. Each row shows its contribution in points; open it to see the data behind it, and open “how it is calculated” for the sources and the step-by-step formula.
Yield
46
Yield
Estimated monthly rent
Our own comparablesEstimated from 0 comparable parking spaces.
From gross rent to net profit
€1,080/year gross- NOI (net)€91885%
- Allowance€16215%
Editable scenario
Adjust rent and occupancyMortgage and cash flow
What you would pay on a mortgage and what would be left each month after rent and costs. Adjust the deposit, the term and the reference Euribor.
Financing of the price () · deposit · up-front investment
Current 12M Euribor 2.86% (ECB · Jul 2026), editable with the slider (±2 pts). An indicative estimate on a French amortisation schedule; it excludes insurance and rental taxation. Monthly costs assumed: €13/month.
How this factor is calculated
It measures the estimated annual net yield: the market rent minus recurring costs (IBI, service charge and an allowance for voids, arrears and maintenance), divided by the total capital invested. Where the rent rests on few comparables, we adjust the score downward. It is the heaviest factor because it represents the real return you would earn as an investor.
- Our own rental catalogueOur deduplicated sample of rents for the same asset class. These are asking rents, not closed ones, and where the municipality gives too small a sample it is blended with the provincial and national ones by how much data there is.
- CatastroThe municipality's cadastral values, from which we estimate the property's annual IBI (housing only).
- The agency's advertThe declared price, built area and service charge.
- We take the monthly rent from our own sample of comparable rents and annualise it (× 12) to get the gross income.
- We deduct recurring costs: IBI estimated from the cadastral value (not applicable outside housing), the service charge from the advert and an allowance of 10% (garages and storage) on the rent for voids, arrears and maintenance. What is left is the NOI (net operating income).
- We divide the NOI by the capital actually invested: the price of the whole asset plus the estimated renovation cost (€600/m² when the advert states it needs renovation). That is the net yield.
- We turn that net yield into a 0–100 mark on a saturating curve: 3% is worth ~39 points, 5% ~57 and 9% ~78. Going from 3% to 5% adds far more than going from 12% to 14%, because the real jump in quality is larger too.
- We adjust for the reliability of the rent: × 1.00 when the estimate is high-confidence or the property already earns a rent, × 0.95 when it is medium, × 0.88 when it is low. That confidence comes from the measured error of the sources behind the estimate, not from how many adverts we happen to hold. An unreliable rent cannot top the ranking.
- We drop net yields above 20% from the score: at those levels there is almost always a data error (price on request, wrong floor area) and leaving them in would distort the whole scale.
- Gross annual rent €90/month × 12 months €1,080/year Rent from our own sample of comparable rents.
- Recurring costs for the year 10% × €1,080 allowance €162/year
- NOI (net operating income) €1,080 − €162 €918/year
- Capital invested €10,500 price €10,500
- Net yield €918 ÷ €10,500 × 100 8.74%
- Scoring curve 100 × (1 − e^(−8,74 ÷ 6)) 76,7/100
- Adjustment for rent reliability 76,7 × 0,88 46/100 low reliability on the rent used.
46/100 × 34% = +16 pts of the 100 in the overall score
Purchase value
100
Purchase value
How this factor is calculated
It compares the asking price against the municipality's official appraisal (MIVAU, €/m² of open-market housing) and rewards smaller investment tickets. Buying below appraisal gives a margin of safety, and with less capital at risk the same return means less exposure.
- The agency's advertAsking price and transaction type. The MIVAU appraisal only covers housing, so there is no official value to check against here.
- There is no official appraisal outside housing, so this factor rests on ticket size alone, at full weight. We renormalise rather than injecting a neutral 50, which would cap the factor at 80 for no real reason.
- The ticket is measured on a straight line: €80,000 scores ~100 and €1,200,000 scores ~0.
- We always use the price of the whole asset, not the advert's: on the sale of a share the price is extrapolated to 100% so that half a house does not look like a cheap ticket.
- We apply caps when the price is not comparable with an ordinary sale: protected housing 50 (the price is set by law, not the market), bare ownership / auction / deed in lieu / leasehold transfer 40 and share sale 60. They are caps, never rewards.
- Ticket size 100 − (€10,500 − €80,000) × 100 ÷ €1,120,000 100,0/100
- No official appraisal to compare against The ticket carries 100% instead of 60% 100,0/100
- Result 100,0 rounded 100/100
100/100 × 16% = +16 pts of the 100 in the overall score
Municipal momentum
59
Municipal momentum
Rent price index
INE · 2011 base = 100 · yearly
Housing transactions
MIVAU · deals per year
These series describe the municipality's housing market; for this asset they are context for the area, not for its own segment.
Investment guide for Cornellà de Llobregat
How this factor is calculated
It sums up where the local market is heading from official series: the rent price index (INE) and transaction volume (MIVAU). A rising municipality better sustains the asset's value and makes a future resale easier; a cooling one costs points.
- INE · Rent price indexAn annual series per municipality, 2011 base = 100. It marks the direction of rents, which is what sustains future yield.
- MIVAU · Housing transactionsRegistered deals per municipality and year. It marks whether the market is picking up or cooling.
- We take the municipality's annual official series and compute their recent change, not a single isolated year: one blip is not momentum.
- We combine those changes into a 0–100 index where 50 is exactly a flat market, above it is rising and below it is cooling.
- Where the municipality has no long enough series, we leave the factor at a neutral 50. We never penalise a municipality because the INE does not publish its series: the missing data shows up in the confidence, not in the score.
- Registered population 50 +14 — year-on-year change ≈ +0.7% × 20 64/100
- Rent price index 50 +13 — year-on-year change ≈ +2.6% × 5 63/100
- Housing transactions 50 −22 — year-on-year change ≈ −11.0% × 2 28/100
- Appraised housing value (€/m²) 50 +32 — year-on-year change ≈ +8.0% × 4 82/100
- Average of the 4 available series (64 + 63 + 28 + 82) ÷ 4 59/100
59/100 × 12% = +7 pts of the 100 in the overall score
Demand
64
Demand
Registered unemployment
SEPE · yearly average
Average gross income
AEAT · annual tax return
Registered population
INE · yearly population register
Net international migration
INE · immigration − emigration · yearly
Recorded offences
Ministry of the Interior · cumulative
Recorded offences (municipalities over 20,000 residents only, from 2024) are territorial context: they do not label an area “safe” or “unsafe”, nor do they measure tenant risk.
How this factor is calculated
It assesses the structural depth of the municipality's demand: gross household income (AEAT), the labour market (registered unemployment and contributions) and net international migration (INE). The deeper the demand base and the better the income, the easier it is to let without voids.
- SEPE · Registered unemploymentThe municipality's annual average of registered unemployed, normalised per 1,000 residents so it is comparable across municipalities of any size.
- AEAT · Average gross incomeIncome declared per household in the municipality. It marks how much rent the area can pay without strain.
- INE · Population register and migrationRegistered population and net international migration. A growing population sustains occupancy year after year.
- We start from 50 points: the average Spanish municipality.
- Employment: (40 − unemployed per 1,000 residents) × 0.6, capped at ±20 points. A municipality with clearly low unemployment adds up to 20; one with high unemployment subtracts up to 20.
- Household income: (average gross income − €25,000) ÷ 1,000, capped at ±15 points. Every €1,000 of income above the national average adds one point.
- Migration: net international migration per 1,000 residents × 1.5, capped at ±8 points. It is the most forward-looking of the three: people arrive before income rises.
- The rent-control discount does not apply to this asset: the Housing Act's rent caps only affect residential housing.
- Every term is null-safe: where a figure is missing we use the national average in its place, so a municipality with no coverage ends up neutral rather than penalised.
- Base The average Spanish municipality 50
- Employment (40 − 39,2 unemployed per 1,000 residents) × 0.6 +0,5
- Household income (€30,855 − €25,000) ÷ 1,000 +5,9
- International migration 12,53 per 1,000 residents × 1.5 +8,0
- Result 50 +0,5 +5,9 +8,0 64/100
64/100 × 13% = +8 pts of the 100 in the overall score
Liquidity and risk
38
Liquidity and risk
Repossessions are a provincial figure (INE) and turnover is municipal (MIVAU). They measure the market's risk and how easily it resells, not the quality of this particular property.
How this factor is calculated
It measures how liquid and healthy the local market is: transaction turnover per resident (more turnover, easier resale) and the province's repossession pressure (a sign of stress and price risk).
- INE · Housing repossessionsRepossessions on urban housing, a quarterly provincial figure. It is the best open proxy for financial stress in the market.
- INE · Housing stockThe province's housing stock, used as the denominator to normalise repossessions per 1,000 dwellings.
- MIVAU · Transactions + INE · Population registerThe municipality's annual deals over its population, to measure real turnover per 1,000 residents.
- We start from 50 points: a market of normal liquidity and risk.
- Risk: repossessions per 1,000 dwellings in the province × 10, subtracting up to 30 points. A province under high mortgage stress drags prices down even when the specific property is fine.
- Liquidity: (transactions a year per 1,000 residents − 8) × 2, between −10 and +20 points. Eight deals per 1,000 residents is the typical Spanish turnover; above it, reselling is faster.
- The two figures sit at deliberately different territorial levels: mortgage stress is only published per province and turnover genuinely is municipal. We use each at its real granularity instead of faking a precision the data does not have.
- With no data, the factor stays at a neutral 50.
- Base A market of normal liquidity and risk 50
- Risk: housing repossessions 0,74 per 1,000 dwellings in the province × 10 −7,4
- Liquidity: transaction turnover (252 transactions ÷ 92,237 residents × 1,000 = 2,73 − 8) × 2 −10,0
- Result 50 −7,4 −10,0 38/100
38/100 × 10% = +4 pts of the 100 in the overall score
Property data
60
Property data
No notable attributes adjust the score; the full specification is above.
How this factor is calculated
It adjusts the score for the property's own characteristics that affect risk and achievable rent: occupancy, state of repair and, depending on the asset class, energy efficiency, age, access or land classification.
- The agency's advertThe text and specification of the original advert, from which we extract the declared attributes.
- Our own attribute extractionWe normalise that free text into a shared dictionary of attributes (condition, occupancy, energy, fittings) so every advert can be scored by the same yardstick.
- We start from 60 points: a neutral property, nothing notable or worrying.
- Occupancy (all classes): illegally occupied −40 points, the model's heaviest penalty because it can block the asset for years. Tenanted under a live contract +5, because it already earns rent.
- State of repair: new or renovated +20, good condition +12, off-plan or under construction +5, needs renovation −18 (and its cost is also deducted in the yield factor).
- For parking spaces and storage rooms we apply neither housing nor retail adjustments: the factor rests on occupancy and condition, which is what the advert reliably declares for this class.
- Every adjustment is null-safe: a field the advert does not declare adds exactly 0. An advert poor in information is never penalised for being so, it simply stops adding.
- The result is clamped between 0 and 100.
- Base A neutral property, nothing notable or worrying 60
- Result 60, with no scoreable attribute declared 60/100 The advert declares no occupancy, no condition and no attribute that moves this factor: it stays neutral, not penalised.
60/100 × 15% = +9 pts of the 100 in the overall score
Similar properties nearby
Real references of the same municipality and type, to cross-check rent and price. They are not necessarily active offers.
They sell for…
Comparable sales in Cornellà de Llobregat, including those already sold.

This is a shortlisting pass over the advert's data, not a due diligence report. Before deciding, check the points we cannot verify from here:
- The service charge on the space or storage room.
- Real dimensions and accessibility (manoeuvring, ramps, headroom).
- Title: an independent registered plot or an undivided share of the garage.
- The real service charge and, above all, whether any special levies are approved or pending: they appear in the minutes of the last owners' meetings.
- The property's actual IBI: our figure is an estimate from the municipality's cadastral values, not the specific bill.
- Charges, mortgages, seizures or easements in the Land Registry extract.
Medium confidence: coverage is reasonable, with some estimated figures.
Confidence measures how much data we hold, not the quality of the investment. We publish no arrears estimates: income, employment and crime figures are market context, never an indicator of tenant risk.