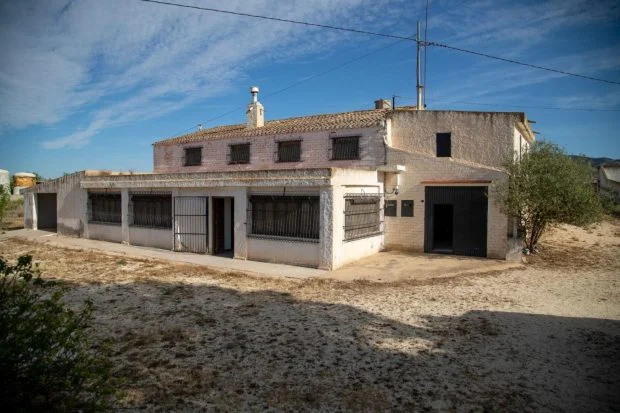
Torre del Rico · Jumilla · Murcia

Jumilla rural estate, cave home, winery

€237,000

Large 37,704 m² estate near Torre del Rico with a main house, connected cave dwelling, pool and 1,023 m² built area. The property includes seven rooms, two bathrooms and a winery requiring renovation.

Reference RML-01557 · On Inmoblia since 26 August 2026 · Published by M&m International

The property

Specifications

What the advert says about the property: floor area, layout, condition and registry details.

Some advert data is uncertain

We show the source-reported value for context, but exclude it from calculations until the conflicting evidence is resolved.

Type
House
Built area (source, uncertain)
1,023 m²
Plot
37,704 m²
Bedrooms
7
Bathrooms
2
Floors in the property
2
Year built
1981
Condition
Needs renovation
Energy certificate
In progress
Fittings

Fittings and extras

What the property comes with and how much each item weighs in the “Property data” sub-score.

  • Air conditioning +3
  • Pool
  • Parking 2 spaces +5

The advert also mentions:

  • Connected cave dwelling with three bedrooms and kitchen
  • Wine cellar building of approximately 700 m²
  • Animal facilities, stables and chicken coops
  • Direct access from the road
  • Adjacent to Sierra del Carche Regional Park
  • Approximately 8 km from Cañada del Trigo
  • Approximately 12 km from Pinoso
  • Approximately one hour from Alicante Airport
  • Approximately one hour from Murcia Airport

Free text we could not normalise into a comparable attribute, so it does not score.

How these values score

Municipal momentum

Where the local market is heading.

Rent price index

INE · 2011 base = 100 · yearly

+3.2% interanual
121.7 20112014201820212024 112.3 · 2011112.3 · 2011106.9 · 2012106.9 · 201299.7 · 201399.7 · 201399.1 · 201499.1 · 2014100 · 2015100 · 2015100.5 · 2016100.5 · 2016102.3 · 2017102.3 · 2017104.3 · 2018104.3 · 2018109.7 · 2019109.7 · 2019111.2 · 2020111.2 · 2020113.8 · 2021113.8 · 2021116.1 · 2022116.1 · 2022118 · 2023118 · 2023121.7 · 2024121.7 · 2024

Housing transactions

MIVAU · deals per year

−6.9% interanual
351 20112015201820222025 126 · 2011126 · 2011234 · 2012234 · 2012126 · 2013126 · 2013280 · 2014280 · 2014242 · 2015242 · 2015174 · 2016174 · 2016231 · 2017231 · 2017264 · 2018264 · 2018285 · 2019285 · 2019250 · 2020250 · 2020349 · 2021349 · 2021361 · 2022361 · 2022332 · 2023332 · 2023377 · 2024377 · 2024351 · 2025351 · 2025

Investment guide for Jumilla

Municipal demand

The structural depth of demand in the area.

11 yearsPurchase affordability
median 7.8 years years of household income to pay for the home (€21,518/year)
+0.6%Rent trajectory
0 = flat average annual growth of the municipal rent index (INE)
10%Unemployment rate (approx.)
median 10% unemployed over unemployed + social security contributors (a proxy comparable across municipalities)
+13.3‰Net migration
median 11.9‰ arrivals minus departures from abroad per 1,000 residents · a growing population sustains demand

Registered unemployment

SEPE · yearly average

−6.6% interanual
1,048 20192021202320242026 1,811 · 20191,811 · 20191,913 · 20201,913 · 20201,858 · 20211,858 · 20211,516 · 20221,516 · 20221,375 · 20231,375 · 20231,243 · 20241,243 · 20241,122 · 20251,122 · 20251,048 · 20261,048 · 2026

Average gross income

AEAT · annual tax return

+3.7% interanual
€21,518 20132016201820212023 €17,426 · 2013€17,426 · 2013€16,946 · 2014€16,946 · 2014€19,613 · 2015€19,613 · 2015€18,390 · 2016€18,390 · 2016€18,489 · 2017€18,489 · 2017€19,404 · 2018€19,404 · 2018€19,955 · 2019€19,955 · 2019€19,603 · 2020€19,603 · 2020€20,364 · 2021€20,364 · 2021€20,747 · 2022€20,747 · 2022€21,518 · 2023€21,518 · 2023

Registered population

INE · yearly population register

0.0% interanual
27,574 20112014201820222025 25,926 · 201125,926 · 201125,926 · 201125,926 · 201125,711 · 201225,711 · 201225,711 · 201225,711 · 201225,710 · 201325,710 · 201325,710 · 201325,710 · 201325,476 · 201425,476 · 201425,476 · 201425,476 · 201425,484 · 201525,484 · 201525,484 · 201525,484 · 201525,362 · 201625,362 · 201625,362 · 201625,362 · 201625,672 · 201725,672 · 201725,672 · 201725,672 · 201725,547 · 201825,547 · 201825,547 · 201825,547 · 201825,600 · 201925,600 · 201925,600 · 201925,600 · 201925,994 · 202025,994 · 202025,994 · 202025,994 · 202026,234 · 202126,234 · 202126,234 · 202126,234 · 202126,596 · 202226,596 · 202226,596 · 202226,596 · 202226,784 · 202326,784 · 202326,784 · 202326,784 · 202327,263 · 202427,263 · 202427,263 · 202427,263 · 202427,574 · 202527,574 · 202527,574 · 202527,574 · 2025

Net international migration

INE · immigration − emigration · yearly

−32.3% interanual
366 2021202220232024 169 · 2021169 · 2021470 · 2022470 · 2022541 · 2023541 · 2023366 · 2024366 · 2024

Recorded offences

Ministry of the Interior · cumulative

+81.0% interanual
2,954 202420252026 321 · 2024321 · 2024662 · 2024662 · 2024996 · 2024996 · 20241,348 · 20241,348 · 20241,632 · 20251,632 · 20251,960 · 20251,960 · 20252,306 · 20252,306 · 20252,672 · 20252,672 · 20252,954 · 20262,954 · 2026

Recorded offences (municipalities over 20,000 residents only, from 2024) are territorial context: they do not label an area “safe” or “unsafe”, nor do they measure tenant risk.

This is a shortlisting pass over the advert's data, not a due diligence report. Before deciding, check the points we cannot verify from here:

  • Possession: that it is vacant, with no squatters and no tenants on a live contract.
  • If it is let, the current rent, the type of contract and its expiry date.
  • The real state of repair and services (possible hidden renovation work) and a valid energy certificate.
  • The real service charge and, above all, whether any special levies are approved or pending: they appear in the minutes of the last owners' meetings.
  • The property's actual IBI: our figure is an estimate from the municipality's cadastral values, not the specific bill.
  • Charges, mortgages, seizures or easements in the Land Registry extract.